What The Wall Street Cheat Sheet Says About Stocks Now
Risky “high-beta” tech stocks are typically more sensitive to market sentiment, making them a useful gauge for spotting changes in investor emotions.
Warren Buffett said it best: “Be fearful when others are greedy, and be greedy when others are fearful”. That simple mantra about going against the crowd can help you sell closer to the top and buy closer to the bottom. But to do that, you’ll need to keep an eye on sentiment – i.e., how most investors feel – and try to feel the opposite. So I’ve pulled out the famous Wall Street Cheat Sheet’s Psychology of a Market Cycle Guide to get you started.
How does the cheat sheet work?
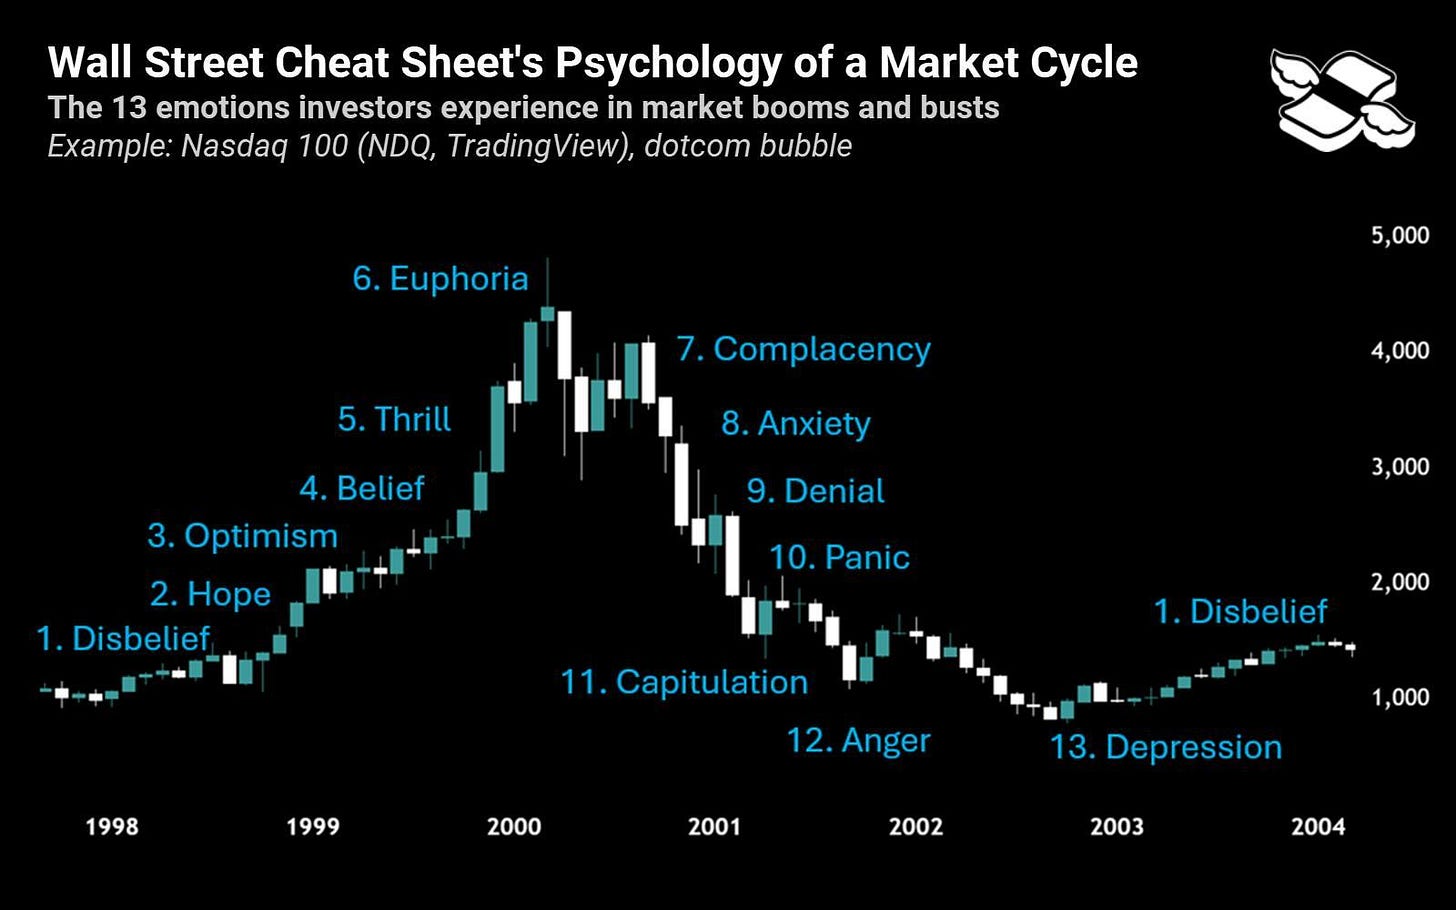
The cheat sheet lists 13 emotions that investors go through during the boom and bust of a stock market cycle. I’ve drawn my own version below using the Nasdaq’s dot-com bubble – but you can apply it to any investment with major price swings. (Looking at you, crypto). Keep in mind, this particular cycle example is extreme – but it does vividly explain the concept.
During a typical boom and bust market cycle, investors experience 13 emotions, according to the Wall Street Cheat Sheet’s Psychology of a Market Cycle. Sources: Wall Street Cheat Sheet, TradingView.
According to the cheat sheet, you can simplify a market cycle into four key phases: expansion (when prices rise), peak (when prices top out), contraction (when prices fall), and trough (when prices bottom out). The phases overlap somewhat, but each one has telltale signs of investor emotional behavior.
Keep reading with a 7-day free trial
Subscribe to Finimize Analyst Desk to keep reading this post and get 7 days of free access to the full post archives.


