
Three Sectors And Six Stocks: Where The Charts Say To Look Now
When you use a series of simple moving averages and momentum signals to sift through every sector, you come up with the stocks and ETFs that are worth watching. And Russell’s done just that.

Technical analysis lives in the moment. And that makes its tools particularly well-suited to this moment, with markets becoming more volatile and lacking clear direction.
For a while now, I’ve been leaning on an approach that uses simple moving averages (SMAs) and moving average convergence divergence (MACD) to flag opportunities across stocks, bonds, and other assets. I’ve also been relying on it to decide where to set my stop-losses, so I can plan exactly where to cut and run in case things don’t go the way I expect.
So, let’s take a look at where the strategy’s pointing me now, after all the market’s recent zigzags.
Part 1: Where things stand with the S&P 500
I started by turning my lens to the S&P 500, looking into its eleven sectors, in hopes of digging up stock ideas. That’s not busywork or some wild goose chase: sector and industry trends account for over 40% of a stock’s move in developed markets. So if a sector’s hot, chances are several of its firms are generating that heat.
The table below shows the performance of each of the 11 major US stock sectors, the overall S&P 500 (which has a tech-heavy focus, because it assigns a weighting to each of the 500 companies based on market cap), and the equal-weight S&P 500 (which weights each of the 500 in equal measures). For each of these, I used ETFs that track the underlying sectors and indexes as stand-ins. They tell the story, and they’re super easy to trade.
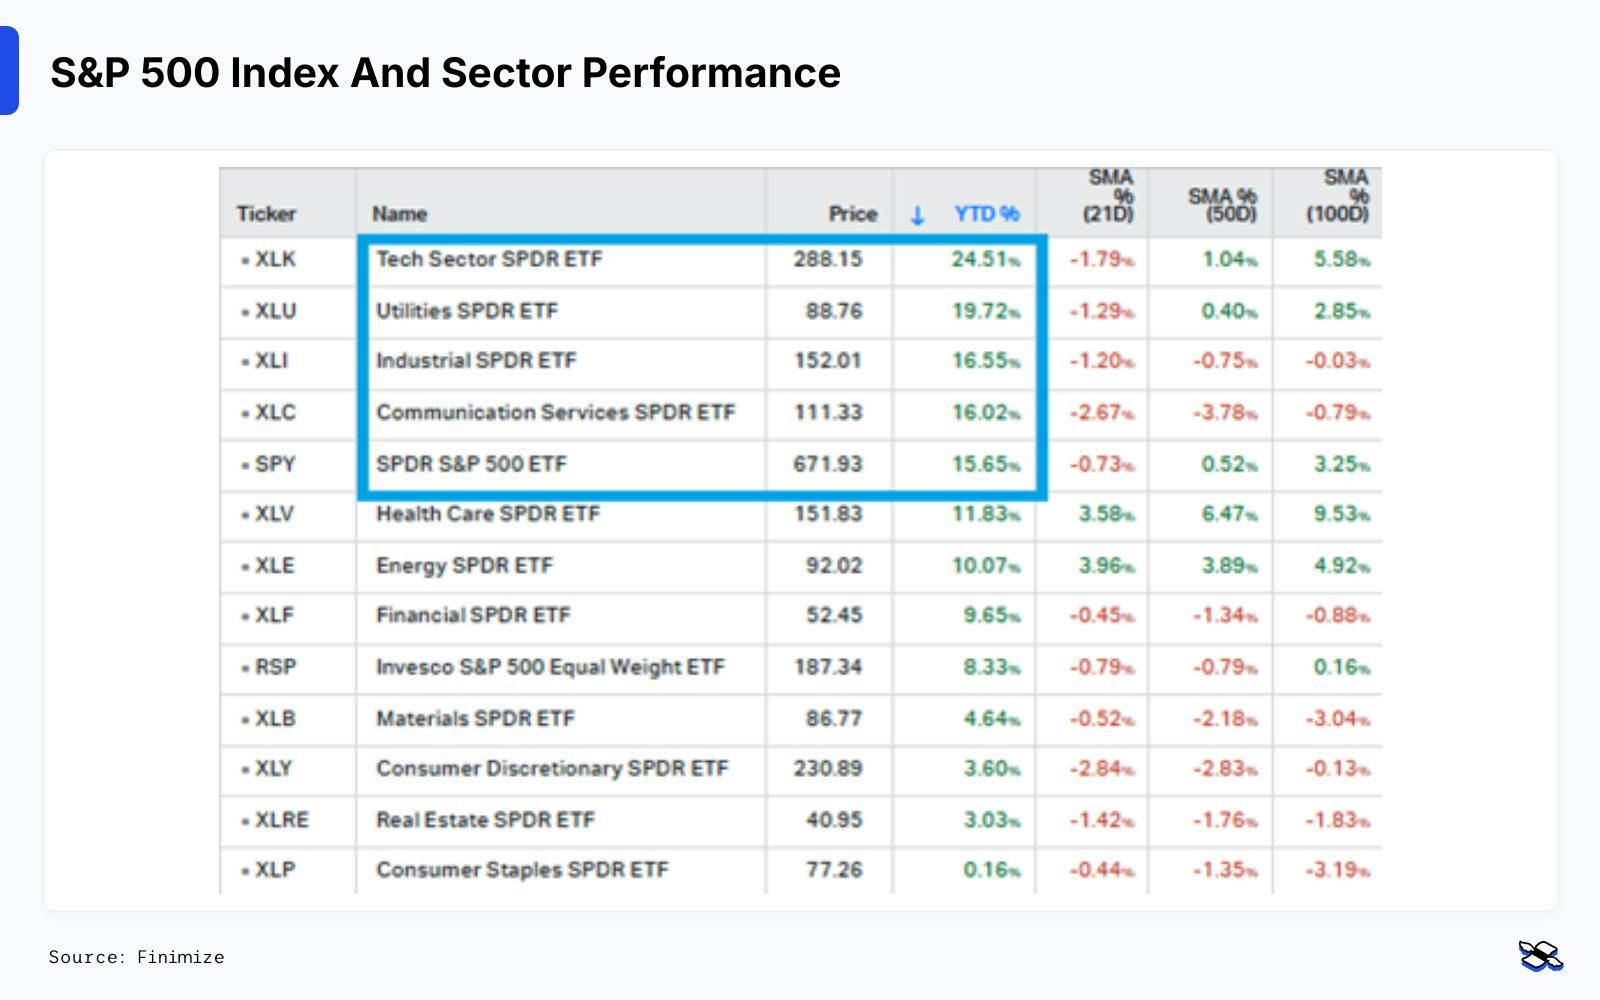
The performance of the S&P 500, the equally weighted S&P 500, and the 11 US stock sectors so far this year, and their prices compared to their 21-, 50-, and 100-day simple moving averages. Source: Koyfin.
The SPDR S&P 500 ETF (ticker: SPY; expense ratio: 0.09%) has gained 15% this year, with only four sector ETFs posting higher returns: the technology sector represented by the Technology Select Sector SPDR ETF (XLK, 0.08%), utilities by the Utilities Select Sector SPDR ETF (XLU; 0.08%), communication services by the S&P Communication Services SPDR ETF (XLC; 0.08%), and industrials by the Industrial Select Sector SPDR ETF (XLI; 0.08%).
Only 174 of the 500 S&P companies have beaten the index this year – and most are clustered in the best-performing sectors. In those categories, winners simply outnumber losers.
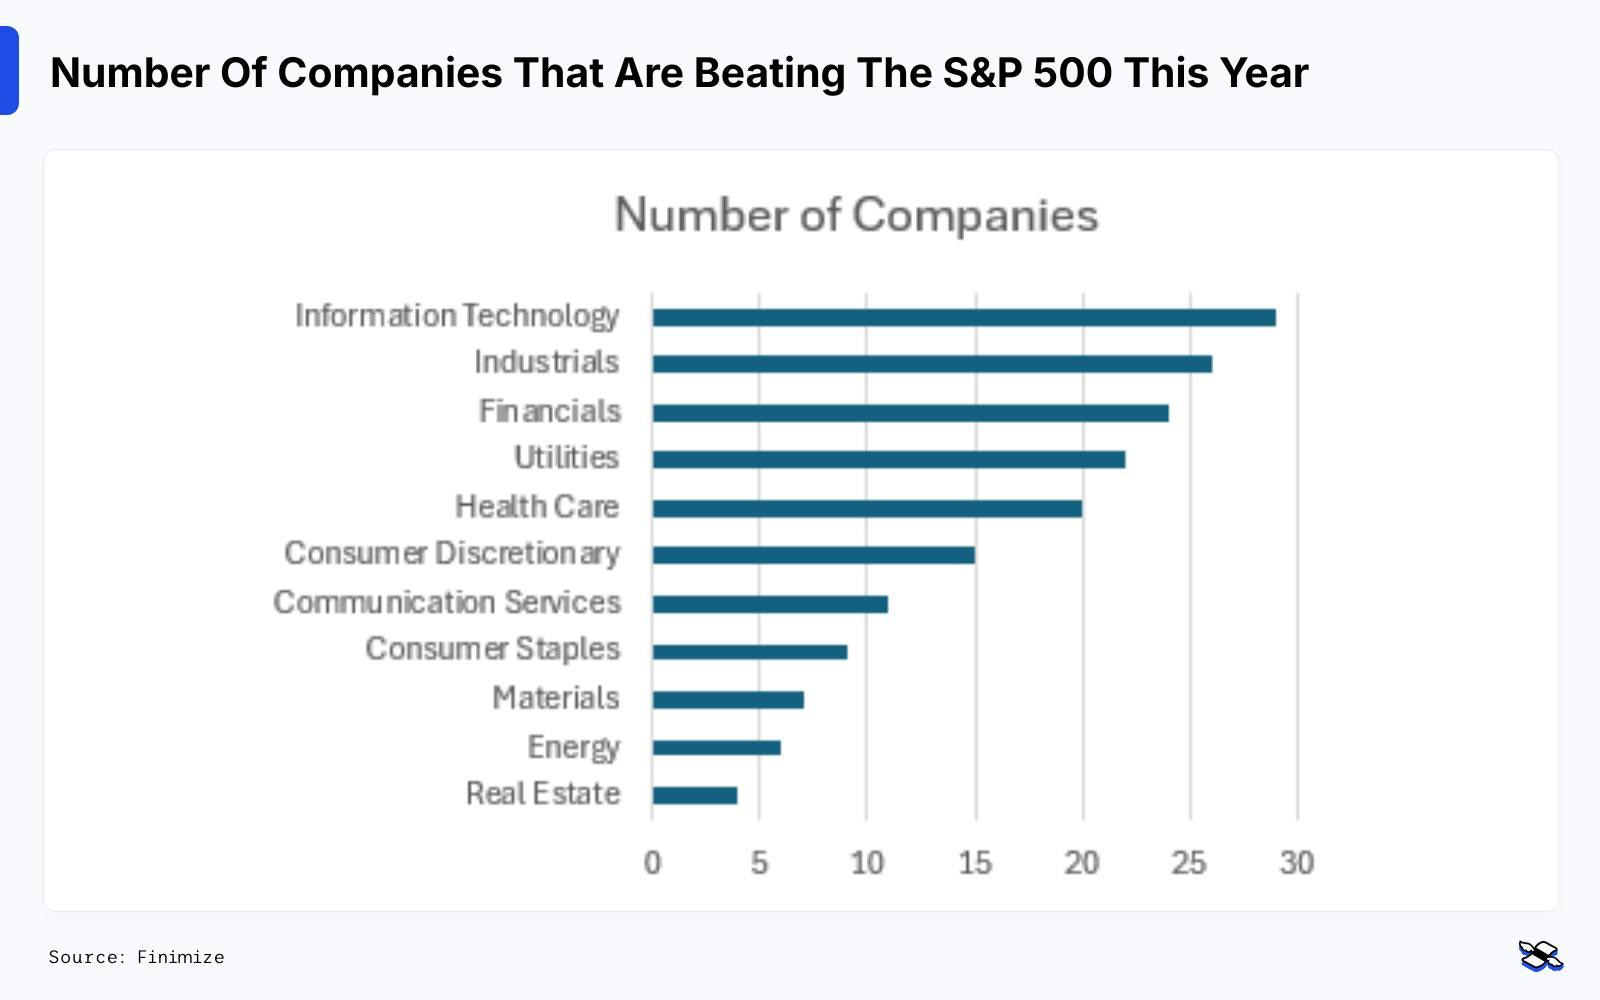
The number of companies that have outperformed the S&P 500 so far this year, by sector. Sources: Koyfin, Finimize.
The S&P 500’s been trending upward since April and hasn’t closed below its 50-day moving average (the green line) since then. October and November selloffs came close, but the index bounced back each time – great news for buy-the-dip traders.
It slipped below the line intraday again on Friday, but managed to bounce back above before the day ended. With the MACD (lower panel red bars in histogram) still flashing sell, though, there’s a real risk of a break lower.
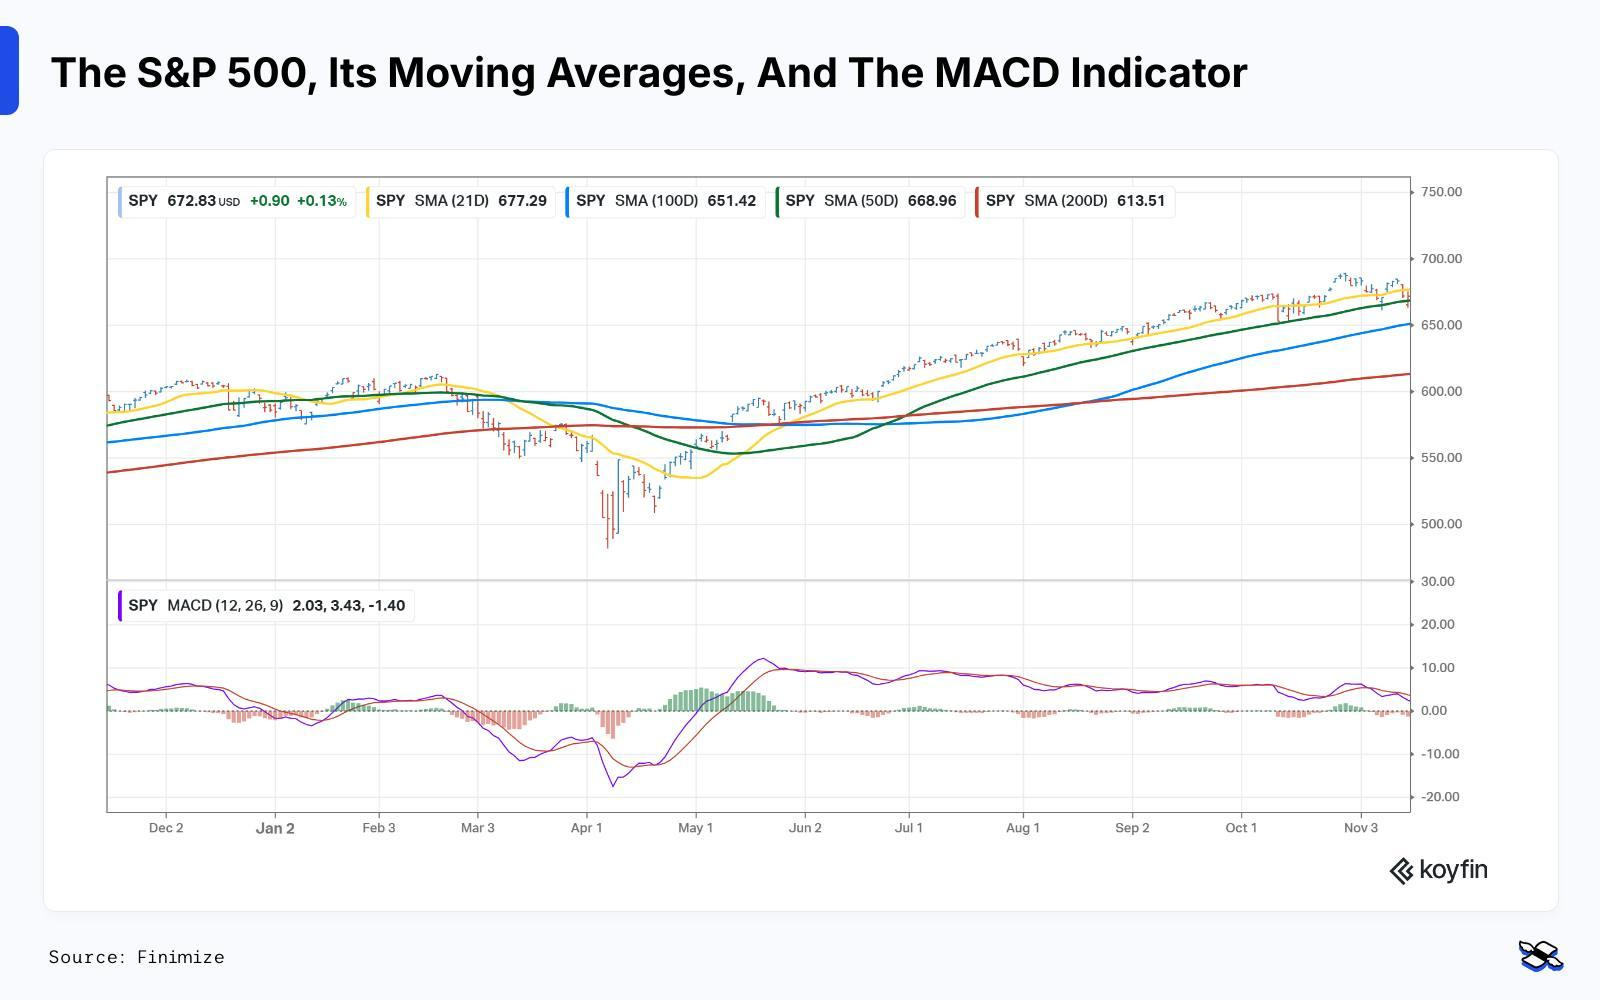
The S&P 500 ETF (in blue and red “candles”) has closed above the 50-day SMA (green), the 100-day SMA (blue), and the 200-day SMA (red). The MACD indicator (lower panel red bars in the histogram) is indicating sell. Source: Koyfin.
So the market looks a little precarious. Still, it makes sense to stick with the S&P 500 ETF as long as it continues to close above the 50-day moving average. If it closes below, though, that’ll increase the risk of a bigger drop to the 100-day line (blue).
And two key events on the calendar could well move the market. First, Nvidia will deliver its quarterly earnings update on Wednesday. The market’s expectations are through the roof, and this report could set the tone for tech. Second, the Federal Reserve will make an interest rate announcement in mid-December. And recent talk about the likelihood of fewer rate cuts has the stock market feeling pretty glum.
